Posts

Showing posts from May, 2018

REFERENCES

Leary, M. R. (2013). Need to Belong Scale. Measurement Instrument Database for the Social                       Sciences. Retrieved from http://www.midss.org/content/need-belong-scale Canty-Mitchell, J. & Zimet, G.D. (2000). Psychometric properties of the Multidimensional Scale of Perceived Social Support in urban adolescents. American Journal of Community Psychology , 28 , 391-400. Zimet, G.D., Dahlem, N.W., Zimet, S.G. & Farley, G.K. (1988). The Multidimensional Scale of Perceived Social Support. Journal of Personality Assessment , 52 , 30-41. Zimet, G.D., Powell, S.S., Farley, G.K., Werkman, S. & Berkoff, K.A. (1990). Psychometric characteristics of the Multidimensional Scale of Perceived Social Support. Journal of Personality   Assessment ,  55 , 610-17.

7) RELIABILITY

Image
To test the reliability of the scale, we use Cronbach's Alpha in IBM SPSS REPORTING RELIABILITY IN APA STYLE Reliability : Need to Belong Scale ( Leary, Kelly, Cottrell and Schreindorfer, 2005) The need to belong scale was used to measure IIUM students towards the feeling of belonging. A total of 40 IIUM students answered this scale consisted of 10 items. The Cronbach alpha for these 10 items was 0.385, indicating unacceptable reliability. Reliability : Multidimensional Scale of Perceived Social Support (Zimet, Dahlem, Zimet and Farley, 1998) The multidimensional scale of perceived social support was used to measure IIUM students towards social support. A total of 40 IIUM students answered this scale consisted of 12 items. The Cronbach alpha for these 12 items was 0.860, indicating good reliability.

6) ANOVA

Image
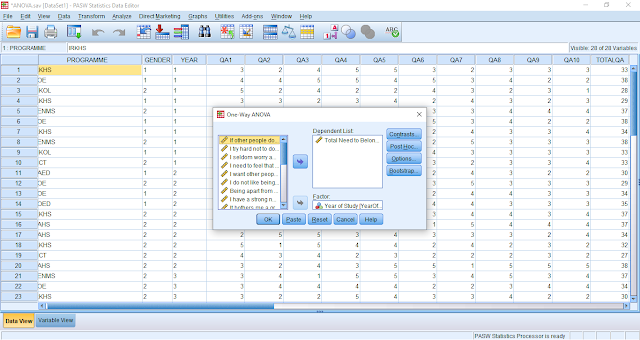
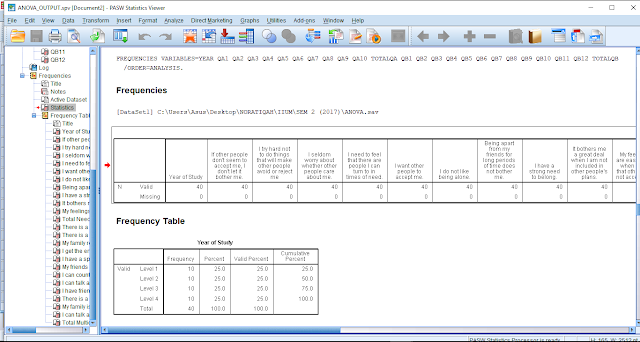
For this project, we were assigned to run a statistical test which is One-way Independent ANOVA. Our aim for this project is to test whether there are significant differences between the 4 level of studies and   Need to Belong Scale (Leary, Kelly, Cottrell, & Schreindorfer, 2005) as well as  Multidimensional Scale of Perceived Social Support (Zimet, Dahlem, Zimet & Farley, 1988). The Independent Variable (IV) is The level of studies of IIUM students which consist Level 1, Level 2, Level 3 and Level 4 while, for the Dependent Variable (DV) are;  Need to Belong Scale (Leary, Kelly, Cottrell, & Schreindorfer, 2005) and  Multidimensional Scale of Perceived Social Support (Zimet, Dahlem, Zimet & Farley, 1988) First, after clicking the button "Analyze", we click on the "Compare Means" and choose "One-way ANOVA". Step 3  Step 4 Step 5 Then, click "Continue" an OK  Next,  to measure the ef...

5) DATA SCREENING

Image
DATA ENTRY ERRORS  We used descriptive statistics to examine any data entry errors. OUTLIERS Then, we run histogram to find Outliers scores in each of the questions.  Histogram table represents one of the questions from QA (Need to Belong Scale) Histogram table represents one of the questions from QB (Multidimensional Scale of Perceived Social Support) MISSING VALUES  Therefore, we found out that there are no Missing Values in our Data entry. COMPUTING VARIABLES After all the process we compute the variables to find the total variable of QA and QB. QA (Need to Belong Scale) QB (Multidimensional Scale of Perceived Social Support) SPLITTING DATA We used "Split File" to run statistical analysis to classify the scales without the need for us to separate in into different files.

4) CODEBOOK

Image
     In preparing codebook, we click the "Analyze" button in the SPSS, then "Report" and we click "Codebook".      From the Variables tab, we move the independent and dependent variables  to the "Codebook Variables Box".  After we completed the step in the variables tab, we move to the Output tab and tick  Label, Value Label , and Missing Values.       The final step is we tick all options box in both sections in the Statistics tab and then click "OK".  Here are the example of our Codebook Outputs. Codebook Outputs

3) NAMING VARIABLES AND CHARACTERISTICS

Image
Because of the large number of variables, we simplify the name to make it understandable. These are the Data View after we make changes from the Variable View For the first scale,  Need to Belong Scale (Leary, Kelly, Cottrell, & Schreindorfer, 2005), we used the name QA1 to QA10 to represent the variables. QA indicates the first scale while the number 1 to 10  represents the number of questions. Then, we label the value of the scale as; "1"  Strongly Disagree "2"  Moderately Disagree "3"  Neither Agree Nor Disagree "4"  Moderately Agree "5"  Strongly Agree We repeated the steps for the second scale,  Multidimensional Scale of Perceived Social Support (Zimet, Dahlem, Zimet & Farley, 1988), as QB1 to QB12 to illustrate each variable. QB  to signify the second scale while number 1 to 12  represents the number of questions.  After that, w e label the value as "1"  Very...

2) DATA ENTRY

Image
From 64 responds we received,  we randomly choose 40 participants which are 10 participants from each level of studies. The samples includes students from  different courses. After sorting the data, we transfer it from Microsoft Excel to SPSS (PASW) STATISTICS.

1) COLLECTING DATA

Image
Our group have used Google Form as a medium to distribute the questionnaire and collect our data. We are require to collect responds from 10 students from each level of study. At the end, we successfully received 64 respondents from various levels of study and kulliyyah. All the data were transformed into Microsoft Excel spreadsheets.

SCALES

Image
We are using SPSS ( Statistical Package for Social Science) to compute and interpret the data obtained from the respondent of the survey. We choose 2 types of scales for our project. Here we provide and attach the sample scales.                          Need to Belong Scale (Leary, Kelly, Cottrell, & Schreindorfer, 2005) This scale was labelled as QA in SPSS Respondents were asked to answer all items, for the first scale  the number represent the answers are: "1"  Strongly Disagree "2"  Moderately Disagree "3"  Neither Agree Nor Disagree "4"  Moderately Agree "5"  Strongly Agree Multidimensional Scale of Perceived Social Support (Zimet, Dahlem, Zimet & Farley, 1988) This scale was labelled as QB in SPSS We label this scale in SPSS as QB And for the second scale,    the numbers that represent...