5) DATA SCREENING
DATA ENTRY ERRORS
We used descriptive statistics to examine any data entry errors.

OUTLIERS
Then, we run histogram to find Outliers scores in each of the questions.
 |
| Histogram table represents one of the questions from QA (Need to Belong Scale) |
 |
| Histogram table represents one of the questions from QB (Multidimensional Scale of Perceived Social Support) |
Therefore, we found out that there are no Missing Values in our Data entry.
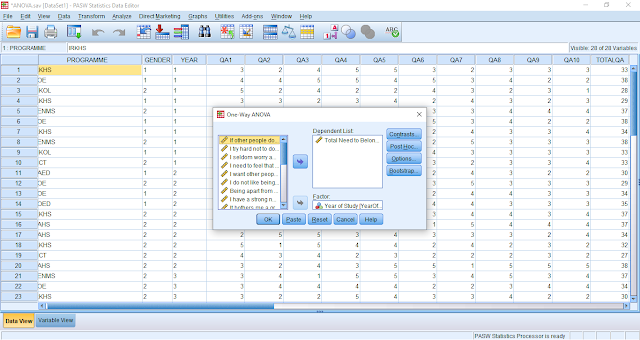
COMPUTING VARIABLES
After all the process we compute the variables to find the total variable of QA and QB.
 |
| QA (Need to Belong Scale) |
 |
| QB (Multidimensional Scale of Perceived Social Support) |
SPLITTING DATA
We used "Split File" to run statistical analysis to classify the scales without the need for us to separate in into different files.


Comments
Post a Comment