6) ANOVA
For this project, we were assigned to run a statistical test which is One-way Independent ANOVA.
Our aim for this project is to test whether there are significant differences between the 4 level of studies and Need to Belong Scale (Leary, Kelly, Cottrell, & Schreindorfer, 2005) as well as Multidimensional Scale of Perceived Social Support (Zimet, Dahlem, Zimet & Farley, 1988).
INTERPRETING THE RESULTS IN APA STYLE
Our aim for this project is to test whether there are significant differences between the 4 level of studies and Need to Belong Scale (Leary, Kelly, Cottrell, & Schreindorfer, 2005) as well as Multidimensional Scale of Perceived Social Support (Zimet, Dahlem, Zimet & Farley, 1988).
The Independent Variable (IV) is The level of studies of IIUM students which consist Level 1, Level 2, Level 3 and Level 4 while, for the Dependent Variable (DV) are; Need to Belong Scale (Leary, Kelly, Cottrell, & Schreindorfer, 2005) and Multidimensional Scale of Perceived Social Support (Zimet, Dahlem, Zimet & Farley, 1988)
First, after clicking the button "Analyze", we click on the "Compare Means" and choose "One-way ANOVA".

 Next, to measure the effect size we click "Analyze", "Compare Means" and choose "Means"


First, after clicking the button "Analyze", we click on the "Compare Means" and choose "One-way ANOVA".
 |
| Step 3 |
 |
| Step 4 |
 |
| Step 5 Then, click "Continue" an OK |


Step 4
Insert dependent list with dependent variable and independent list with the independent variable

Step 5
Choose "Mean", "Number of Cases" and "Standard Deviation" for the cell statistics column. Tick on the "Anova Table" and "eta" under Statistics for First Layer.
The output for the effect size are also referred as Eta Square
 |
| Effect size for QA |
 |
| Effect Size for QB |
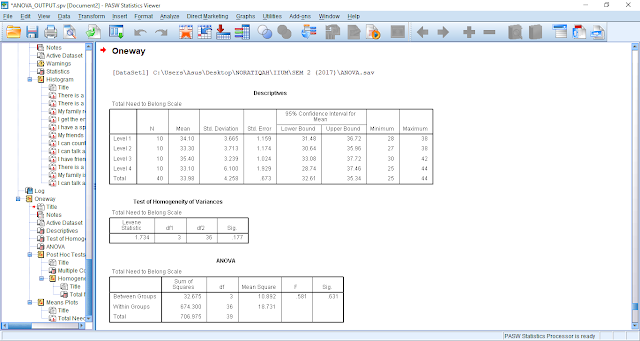
Report: Need to Belong Scale ( Leary, Kelly, Cottrell and Schreindorfer, 2005)
A one- way independent ANOVA was conducted to compare the need of belonging of IIUM students based on their level of study; Level 1, Level 2, Level 3 and Level 4. The need of belonging was not statistically significant, F (3, 36) = 0.581, p = 0.631, with a small effect size (n2 = 0.046). Post hoc comparison using the Tukey HSD test indicated that the mean of belonging score for Level 1 students (M = 34.10, SD = 3.665) is significantly different from Level 2 students (M = 33.30, SD = 3.713, p = 0.976), Level 3 students (M = 35.40, SD = 3.239, p = 0.907) and Level 4 students (M = 33.10, SD = 6.100, p = 0.955). Level 2 students is significantly different from Level 3 students (p = 0.701) and Level 4 students (p = 1.000). The result also showed that the mean score for the need of belonging for Level 3 students is significantly different from Level 4 students (p = 0.638). Taken together, these results suggest that different level of study scored differently on the need to belong scale.
Report: Multidimensional Scale of Perceived Social Support (Zimet, Dahlem, Zimet and Farley, 1998)
A one-way independent ANOVA was conducted to compare the perceived social support of IIUM students based on their Level 1, Level 2, Level 3 and Level 4. The perceived social support was not statistically significant, F (3, 36) = 0.735, p = 0.538, with a small effect size (n2 = 0.058). Post hoc comparison using the Tukey HSD test indicated that the mean score for Level 1 students (M = 59.70, SD = 12.517) is significantly different from Level 2 students (M = 59.00, SD = 11.776, p = 1), Level 3 students (M = 66.30, SD = 12.650, p = 0.620) and Level 4 students (M = 61.60, SD = 11.530, p = 0.985). Level 2 students is significantly different from Level 3 students (p = 0.541) and Level 4 students (p = 0.963). The result also showed that the mean score for the perceived of social support for Level 3 is significantly different from Level 4 students (p = 0.822). Taken together, these results suggest that different level of study scored differently on the multidimensional scale of perceived social support score.


Subscribe to the OUSC Newsletter to stay up to date on the 우리카지노 newest on-line slot releases
ReplyDelete